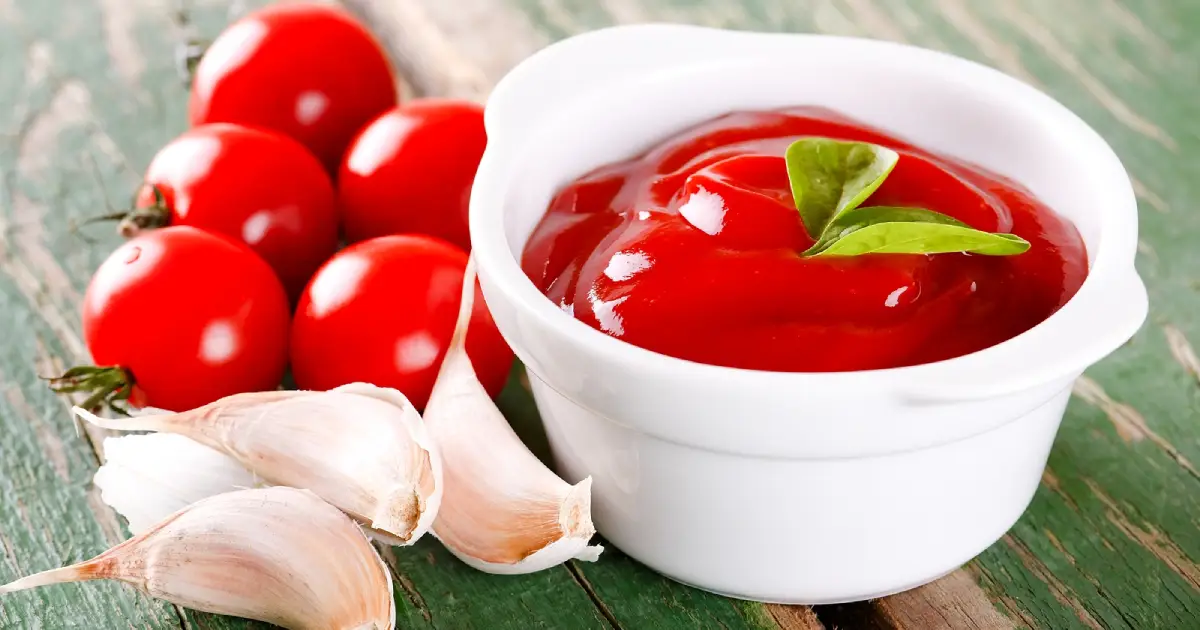
Tomato ketchup is one of the world’s most popular condiments, but is this common tomato product a healthy choice?
Most of what you’ll read on ketchup will be overly negative, but the truth is somewhat more nuanced.
Key Points on Ketchup
- An underestimated source of lycopene: Tomato ketchup is one of the best dietary sources of lycopene, an interesting carotenoid that may have several benefits for human health.
- High in sugar and salt: Most ketchup contains a fair amount of added sugar and salt, making it a common dietary source of sugar and sodium.
- Hedonistic potential: While ketchup is relatively low in calories itself, research shows it may encourage overconsumption of foods it’s commonly eaten alongside due to its flavor-enhancing properties.
Important Note: The content in this article is for informational and educational purposes only. It should not replace medical advice from your healthcare provider.
Table of contents
Potential Benefits of Ketchup

The potential benefits of ketchup primarily revolve around its lycopene content.
Good Bioavailable Source of Lycopene
Ketchup contains large concentrations of a carotenoid called lycopene. According to USDA data, a single 17g tablespoon serving of ketchup provides 2060 mcg of lycopene (1).
Lycopene is naturally found in tomatoes, with a small, 91g tomato offering 2,340 mcg (2). However, it’s actually processed tomato products that provide the most bioavailable source of the carotenoid (3).
This is because lycopene is found within the cell walls of the tomato, which are composed of a type of fiber we struggle to break down during digestion.
The heat and crushing processes used to turn tomatoes into ketchup break down these fibrous cell walls. As a result, not only does ketchup contain a similar amount of lycopene to a whole tomato, but its lycopene content is more bioavailable—meaning it is easier for us to absorb (4).
There is considerable research interest in lycopene due to its potential health benefits, with the carotenoid thought to have antioxidant and anti-inflammatory effects (5):
Recent Research On Lycopene’s Health Benefits
- A 2025 systematic review and meta-analysis found that higher intake and blood levels of lycopene were associated with lower cancer risk and cancer mortality (6).
- Systematic reviews published in 2024 found that lycopene may have a protective effect against UV-induced skin damage as well as lower the risk of liver disease (7, 8).
- Several large observational studies have demonstrated a link between higher tomato and lycopene intakes and a lower risk of all-cause mortality (9, 10, 11, 12).
- Interestingly, a large 2021 observational study found that higher consumptions of lycopene and ketchup were associated with lower total mortality. For ketchup, there was a 7% lower risk in the highest compared to lowest consumers (13).
Please note: Findings from observational studies can provide beneficial data, but they show correlation rather than causation. In other words, although the highest ketchup consumers had a lower risk of all-cause mortality, we shouldn’t confidently say the ketchup caused this.
Other tomato products high in lycopene include:
The Main Drawbacks of Ketchup
May Increase Food Intake
Research has shown that ketchup may have a hedonistic effect. This means that its blend of flavors (e.g. sweet, salty, sour) can make food its added to more enjoyable, thereby encouraging overconsumption of that food.
A randomized controlled trial involving 21 male adults investigated whether adding ketchup to fries increased overall intake. The participants were allowed to eat as much fries as they wanted (14).
Here’s what the study found:
- Fries alone: Participants consumed 270 grams of fries, equal to approximately 740 calories.
- Fries with added ketchup: Participants consumed 297 grams of fries, which is 10% more and equal to 814 calories.
This finding is also supported by research on food variety, with a greater range of dietary foods and flavors thought to increase food intake. A 2021 systematic review and meta-analysis found that food variety was associated with small to moderate increases in food intake, but noted that further randomized controlled trials are required to better confirm this (15).
A Source of Added Sugar
One of the commonly known drawbacks of tomato ketchup is its added sugar content.
For example, USDA data shows that each 17g tablespoon serving of tomato ketchup contains 3.6 grams of sugar on average (16).
However, the precise amounts may vary by brand. Based on the ingredients in Heinz tomato ketchup, this sugar content comes from a mix of high fructose corn syrup, corn syrup, and naturally occurring sugars from tomatoes (17).
Recent systematic reviews have found links between added sugars and a higher risk of:
- Non-alcoholic fatty liver disease (18)
- Gum disease (19)
- Hypertension (20)
- Overweight and obesity (21)
Due to the potential harms of excessive added sugar intake, the FDA has set a daily value of 50 grams for added sugars, which is based on a 2000-calorie diet (22).
Quite High In Sodium
High sodium intakes can lead to elevated blood pressure, particularly when potassium intake is low.
This has been demonstrated in multiple recent systematic reviews of randomized controlled trials, and lower sodium intake is likely to reduce heart disease risk (23, 24, 25).
The daily value for sodium intake is 2,300 mg, but according to the Centers for Disease control (CDC), the average American consumes 3,400 mg of sodium daily (26).
Much of this sodium intake comes from processed foods with high salt levels, and ketchup is one of these food products.
Each 17g tablespoon of tomato ketchup contributes 154 mg of sodium, which is approximately 7% of the daily value (16).
For anyone trying to lower their sodium intake, it’s worth noting that ‘low sodium’ ketchup options are available.
Healthier Alternatives To Ketchup
For those wishing to limit their added sugar or sodium intake, two potential healthier alternatives for ketchup include:
- Low-sodium tomato ketchup: It has a similar flavor and usage profile to ketchup, just with less added salt.
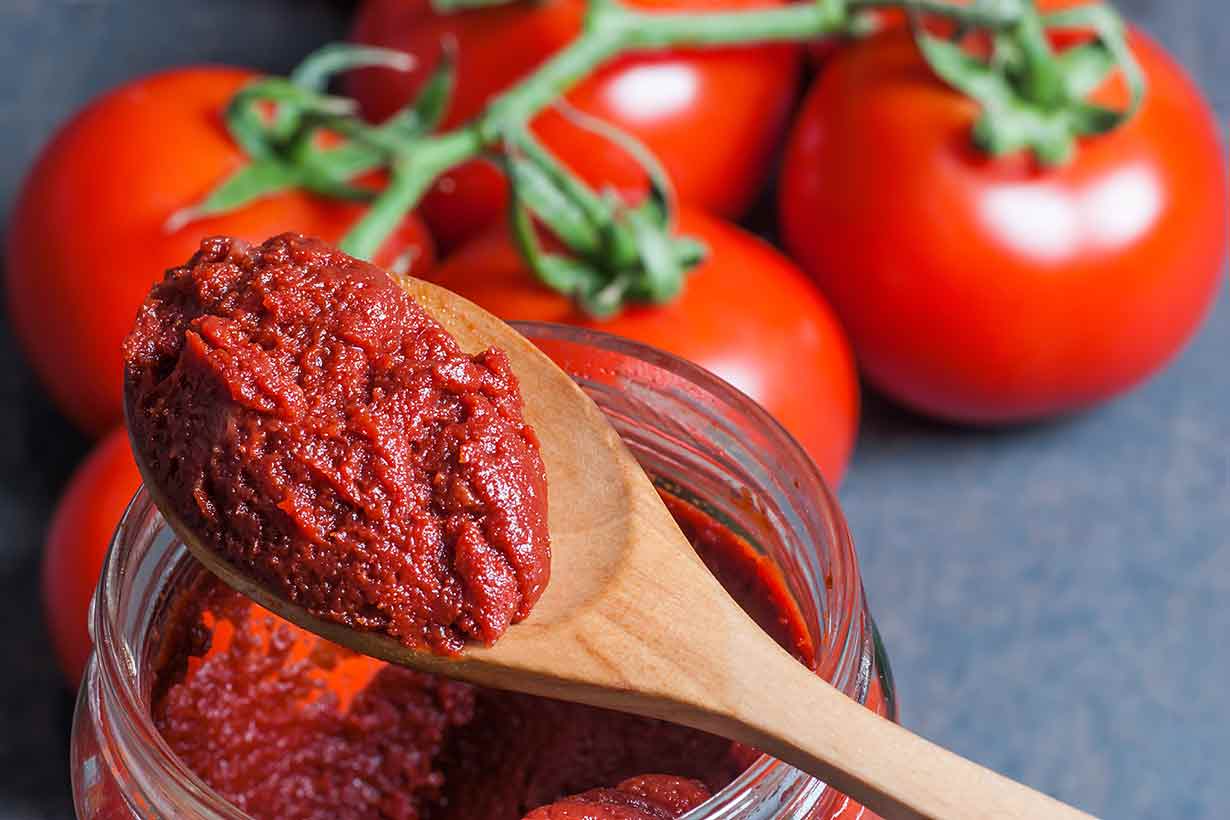
- Tomato paste: While it’s not a straight swap as a condiment, tomato paste is less processed, free of added sugar and salt, and works well as an ingredient.
The table below shows how a tablespoon serving of ketchup, low-sodium ketchup, and tomato paste compare nutritionally for calorie, sugar, sodium, and lycopene content according to USDA data (16, 17, 18).
| Nutrient | Ketchup | Low-sodium ketchup | Tomato paste |
|---|---|---|---|
| Calories | 17 kcal | 17 kcal | 13 kcal |
| Sugar | 3.62 g | 3.62 g | 1.95 g |
| Sodium | 154 mg | 3.4 mg | 9.44 mg |
| Lycopene | 2060 mcg | 2060 mcg | 4610 mcg |
As the table shows, tomato paste offers more than double the lycopene content of ketchup, approximately half the sugar content, and significantly lower sodium levels than regular ketchup.
Low-sodium ketchup is similar to regular ketchup, but contains very low sodium levels, making it a good choice for those trying to limit sodium intake.
The Full Nutritional Profile of Ketchup
Now that we’ve learned some of the potential benefits and drawbacks of ketchup, let’s examine its nutritional values in more detail.
Based on USDA data, the following tables show the calorie, macronutrient, vitamin, and mineral content of ketchup per 100 grams and per 17-gram tablespoon serving (16).
Calories and Macronutrients
| Nutrient | Per 100g | Per 17g tablespoon |
|---|---|---|
| Calories | 101 kcal | 17 kcal |
| Carbohydrates | 27.4g (10% DV) | 4.66g (2% DV) |
| Fiber | 0.3g (1% DV) | 0.05g (<1% DV) |
| Sugars | 21.3g | 3.62g |
| Fat | 0.1g (<1% DV) | 0.02g (<1% DV) |
| Saturated fat | 0.01g (<1% DV) | 0.002g (<1% DV) |
| Monounsaturated fat | 0.02g | 0.003g |
| Polyunsaturated fat | 0.04g | 0.007g |
| Omega-3 | 0.001g | 0g |
| Omega-6 | 0.04g | 0.007g |
| Protein | 1.04g (2% DV) | 0.18g (<1% DV) |
| Cholesterol | 0 mg (0% DV) | 0 mg (0% DV) |
Vitamins
| Vitamin | Per 100g | Per 17g tablespoon |
|---|---|---|
| Vitamin A (RAE) | 26 mcg (3% DV) | 4.42 mcg (<1% DV) |
| Vitamin C | 4.1 mg (5% DV) | 0.70 mg (1% DV) |
| Vitamin D | 0 mcg (0%) | 0 mcg (0% DV) |
| Vitamin E | 1.46 mg (10% DV) | 0.25 mg (2% DV) |
| Vitamin K | 3.0 mcg (3% DV) | 0.51 mcg (<1% DV) |
| Thiamin (B1) | 0.01 mg (<1% DV) | 0 mg (0% DV) |
| Riboflavin (B2) | 0.17 mg (13% DV) | 0.03 mg (2% DV) |
| Niacin (B3) | 1.43 mg (2% DV) | 0.24 mg (2% DV) |
| Pantothenic acid (B5) | 0.05 mg (1% DV) | 0 mg (0% DV) |
| Vitamin B6 | 0.16 mg (9% DV) | 0.03 mg (2% DV) |
| Folate (B9) | 9 mcg (2% DV) | 1.53 mcg (<1% DV) |
| Vitamin B12 | 0 mcg (0% DV) | 0 mcg (0% DV) |
| Choline | 13 mg (2% DV) | 2.12 mg (<1% DV) |
Minerals
| Mineral | Per 100g | Per 17g tablespoon |
|---|---|---|
| Calcium | 15 mg (1% DV) | 2.55 mg (<1% DV) |
| Iron | 0.35 mg (2% DV) | 0.06 mg (<1% DV) |
| Magnesium | 13 mg (3% DV) | 2.21 mg (1% DV) |
| Phosphorus | 26 mg (2% DV) | 4.42 mg (<1% DV) |
| Potassium | 281 mg (6% DV) | 47.8 mg (1% DV) |
| Sodium | 907 mg (39% DV) | 154 mg (7% DV) |
| Zinc | 0.17 mg (2% DV) | 0.03 mg (<1% DV) |
| Copper | 0.09 mg (10% DV) | 0.01 mg (1% DV) |
| Manganese | 0.08 mg (3% DV) | 0.01 mg (<1% DV) |
| Selenium | 0.7 mcg (1% DV) | 0.12 mcg |


